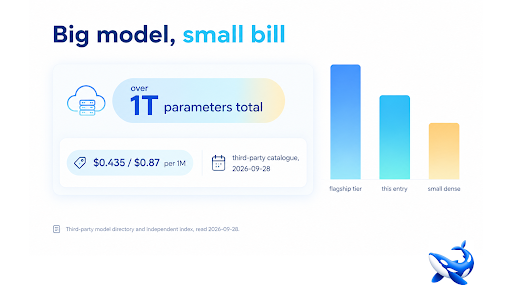
A flagship-scale model with a mid-tier price is the kind of entry that gets filed under “too good” and skipped. This month’s latest AI model releases include one: a Xiaomi model in the MiMo line, listed in a third-party public directory on 21 September 2026 at a total parameter count above one trillion, priced in that same directory on 28 September 2026 at $0.435 per million input tokens and $0.87 per million output tokens. Those two facts are not in tension once you know which number governs the bill. The parameter count describes capacity; the price describes compute per token; a sparse architecture is what lets the first be enormous while the second stays low. On OrcaRouter the catalogue of latest ai model releases lists each entry with the rate you would pay, which is the field that tells you whether a flagship is affordable or merely impressive.
Why a trillion parameters is not a trillion parameters of work
Parameter counts are the most quoted and least informative number in model coverage, and this entry is a good place to see why.
In a dense model, every parameter participates in producing every token. The parameter count is therefore also the compute cost, and a large count means a large bill. In a sparse model — the mixture-of-experts family that most frontier-scale releases now use — only a fraction of the network is active for any given token. The full parameter count is the model’s total capacity, the size of everything it could draw on. The active count is what it actually spends per token, and that is what the provider bills for.
A trillion-plus total with a mid-tier rate is the signature of a very sparse model: a large library, a small reading list per question. It is genuinely cheaper to run than a dense model of the same total size, and it is genuinely more capable than a dense model of the same active size. Both halves of that sentence matter, and the price on the catalogue is the observable consequence.
Reading a rate that looks too low
The rate is low enough that the first instinct should be to check what it applies to, not to assume an error.
Three checks settle it. First, confirm the price is per million tokens and that the input and output rates are the ones you read — a headline figure is often the cheaper of the two. Second, confirm what the price attaches to: some directories record a rate for a fast tier and a different rate for the base model, and the cheaper number may belong to the tier you were not looking at. Third, confirm the entry is the model you think it is — a family name with a version number and a suffix is easy to confuse with a sibling.
Do those three and the number usually turns out to be real. Flagship-scale models are genuinely cheaper per token than they were two years ago, for the architectural reason above, and a headline price that would have been implausible in a previous generation is now ordinary. The instinct to disbelieve is right; the conclusion that it must be a typo is not.
What the independent score adds
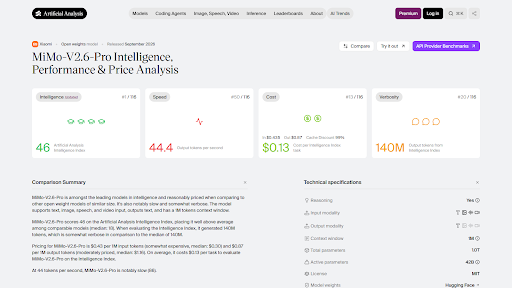
The independent index we checked on 28 September 2026 records 46.32 for this model — a strong general result, in the same band as the other frontier entries in this batch, and worth quoting precisely because it is not exceptional.
That is the useful part. This is not a model that leads a leaderboard; it is a model that lands within a few points of the leaders while being priced well below them. Comparison tables sort by score, so an entry like this appears in the middle of a list of newer, more expensive names and reads as a compromise. Sorted by score per dollar it moves to the front, and no table does that sort for you.
The caveat that travels with any single index figure applies: the configuration matters, and the effort setting behind the number is what makes it comparable or not. Treat the score as bounding capability and read the price for what the capability costs.
The cost question a low rate does not answer
Cheap per token is not the same as cheap per task, and the gap between the two is where a budget actually lives.
A model that costs a third of a competitor per token but takes twice as many turns to finish a task costs more per task. That is not a hypothetical; turn count is the dominant term in agent budgets and it varies far more between models than per-token rates do. The way to get the number is to run a fixed set of your own tasks against the candidates, count turns and tokens together, and divide.
There is a second-order effect worth knowing. A very large sparse model routes each token through a subset of its experts, and routing is a learned decision that can be uneven. On workloads that resemble the model’s training distribution the routing is efficient and the low rate is fully realised. On an unusual distribution the routing overhead can be less favourable, and the effective cost drifts up. This is a reason to measure on your own traffic rather than on a sample task set, and it is not a reason to avoid the model.
What a release like this changes about planning
When a flagship-scale model arrives at a mid-tier rate, the decision it changes is not which model to use for the hardest task. It is the default.
Most teams run a cheap model for the bulk of their traffic and route the hard cases up to something expensive. The cheap tier is usually chosen for price and accepted as a compromise on quality, and the compromise is where a certain class of quiet failure lives: the routine task that the cheap model almost gets right. A model that is within a few points of the leaders at a fraction of the rate does not eliminate that trade, but it moves the line, and moving the line is worth more in practice than winning a leaderboard.
The practical move is to re-run your own acceptance test against it rather than reasoning from the score. If the model passes at your current quality bar, the whole bulk tier can be repriced, and the saving scales with volume in a way that no prompt optimisation will match. If it does not, you have lost an hour and learned where your bar actually sits.
Sourcing note: MiMo-V2.6-Pro’s first appearance in a third-party public model directory on 21 September 2026, its total parameter count above one trillion, and its listed rates of $0.435 per million input tokens and $0.87 per million output tokens were read from that directory on 28 September 2026 and are that directory’s figures, not the vendor’s published price list. The independent index figure of 46.32 is that index’s number for this model as recorded on 28 September 2026. The explanation of sparsity, the three checks on a low rate, the observation about routing efficiency, and the argument about repricing a bulk tier are editorial framing rather than measured results. The statement that this model is not in OrcaRouter’s catalogue is a statement about our own catalogue on 28 September 2026; no rate of ours is quoted for it. This article names no competing platform and describes none.